

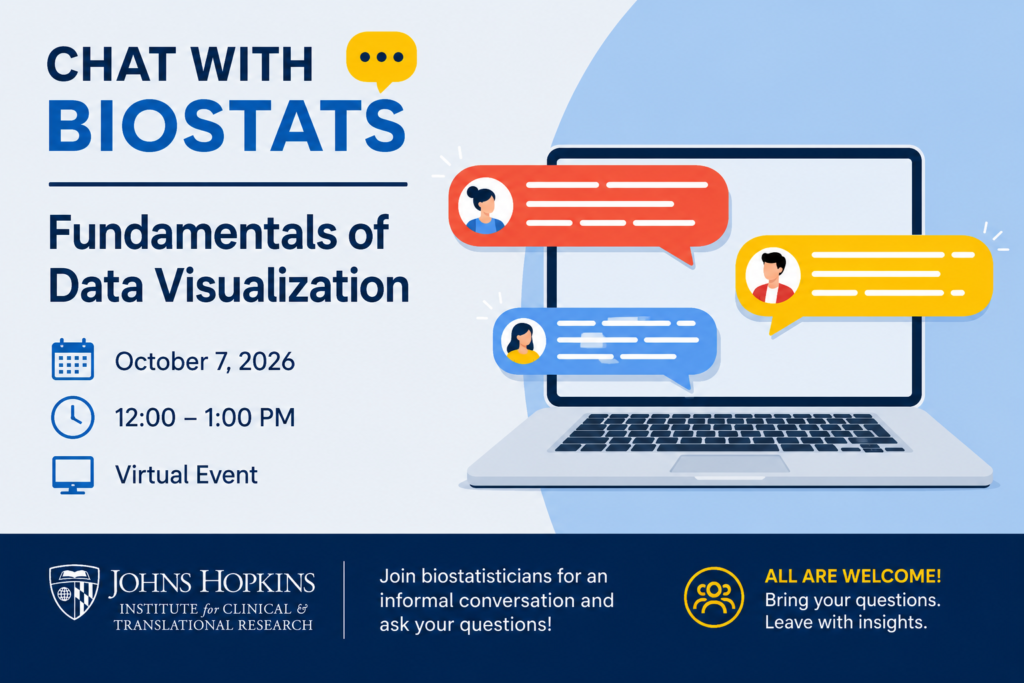
Data visualization is a crucial skill for understanding data and communicating scientific findings. In this session, we will cover the fundamentals of effective visualization for exploratory data analysis and scientific communication, with an emphasis on practical techniques you can apply immediately.
Speaker: Erik Westlund, PhD, is an Assistant Scientist, in the Department of Biostatistics at the Johns Hopkins Bloomberg School of Public Health. He has over 15 years of professional experience in applied data science and statistics across medicine, public health, education, and the social sciences. In addition to using data visualization in his work and collaborations, he has taught numerous workshops and courses on the topic.
“Chat with Biostats” is sponsored by the ICTR Biostatistics and Study Design Program.